This case study compares the greenhouse gas (GHG) emission estimation and gross margin for a 2,000 hectare (ha) South Australian sheep and cattle farm at two different stocking rates:
• 36,000 DSE per annum (18 DSE/ha)
• 30,000 DSE per annum stocking rate (15 DSE/ha)
Data for this case study is not from a particular farm but is typical of the results seen by Pinion Advisory in its benchmarking programs for farms of this size and situation.
Farm characteristics, assumptions, feed supplementation and energy use, herd composition and sales are shown below.
Farm characteristics
• Situated in South Australia
• 2,000 ha of pasture
• Average rainfall of 650mm per annum.
Assumptions
• Dry sheep equivalent = 45 kg dry sheep
• DSE per head = (liveweight/45) 0.75
• Electricity use: 30 kWh/DSE/annum
• Diesel for tractors and farm machinery 4 L/DSE/annum
• Ag chemical use: none
• Mineral supplementation: none
• Breeding ewe lambing percentage is 135%
• Maiden breeding ewe lambing percentage is 90%
Supplementation and energy use
The supplementation and energy use for the two stocking rates is in Table 1.
Table 1 – Supplementation and energy use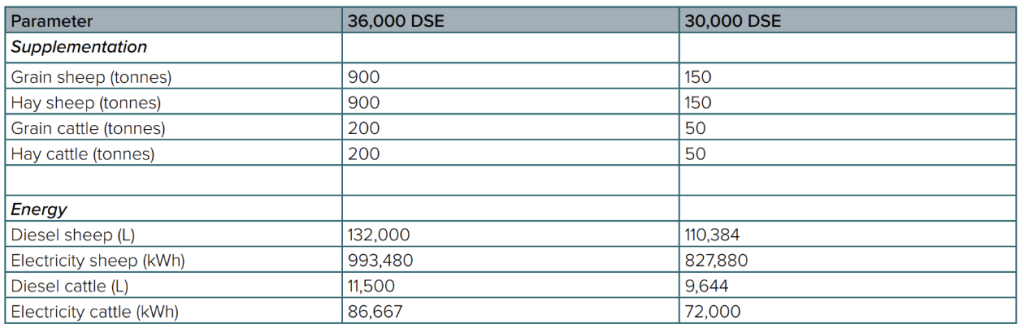
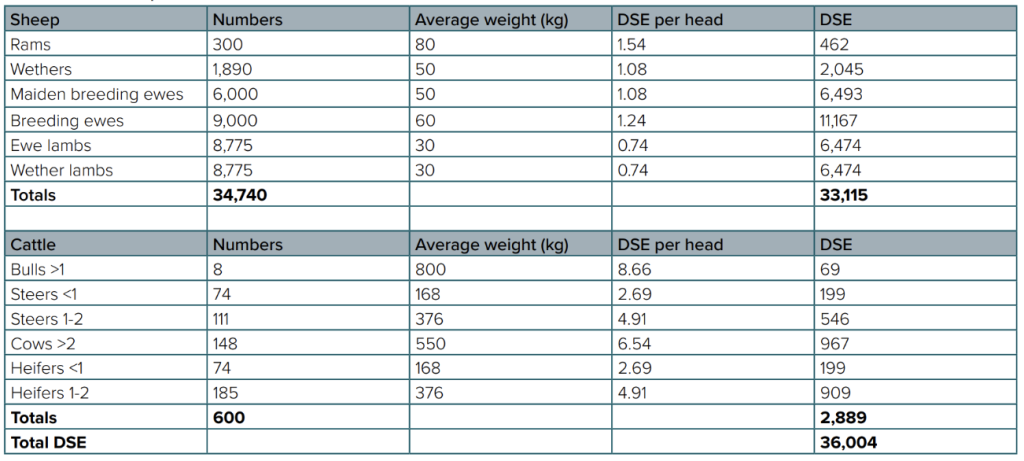
Herd composition
The herd composition at 36,000 DSE is shown in Table 2.
Table 2 – Herd composition at 36,000 DSE
The herd composition at 30,000 DSE is shown in Table 3.
Table 3 – Herd composition at 30,000 DSE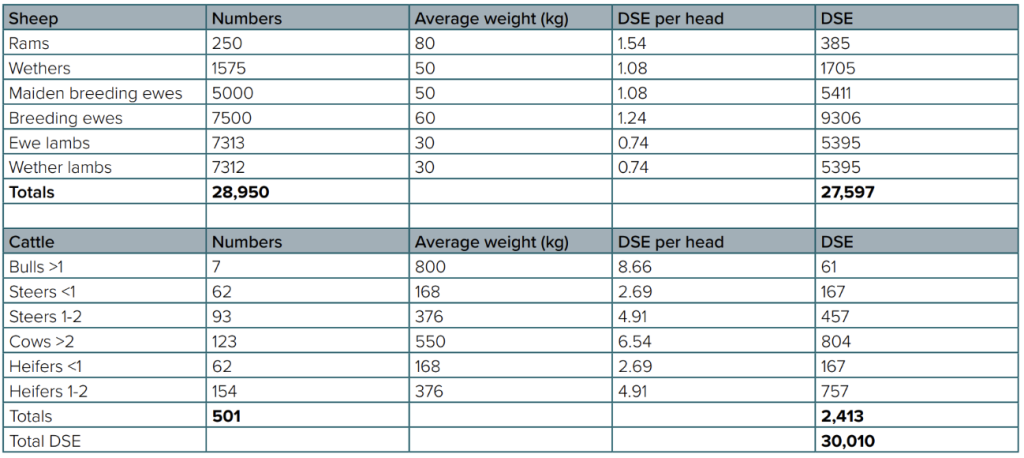
Sales
Sales are shown below in Table 4.
Table 4 – Sales at the two stocking rates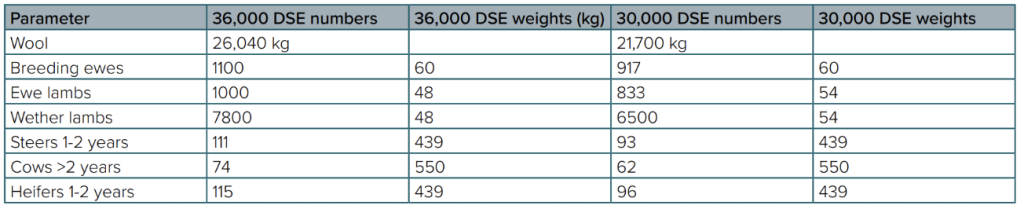
Note: At the lower stocking rate, there was an increase in liveweight gain of 6 kg per sheep.
GHG emissions
Estimates of GHG emissions for the two stocking rates are shown (Lopez, et al., 2025) in Table 5 and Table 6.
Table 5 – GHG emissions estimation for 36,000 DSE
Beef & Sheep Greenhouse Accounting Tool
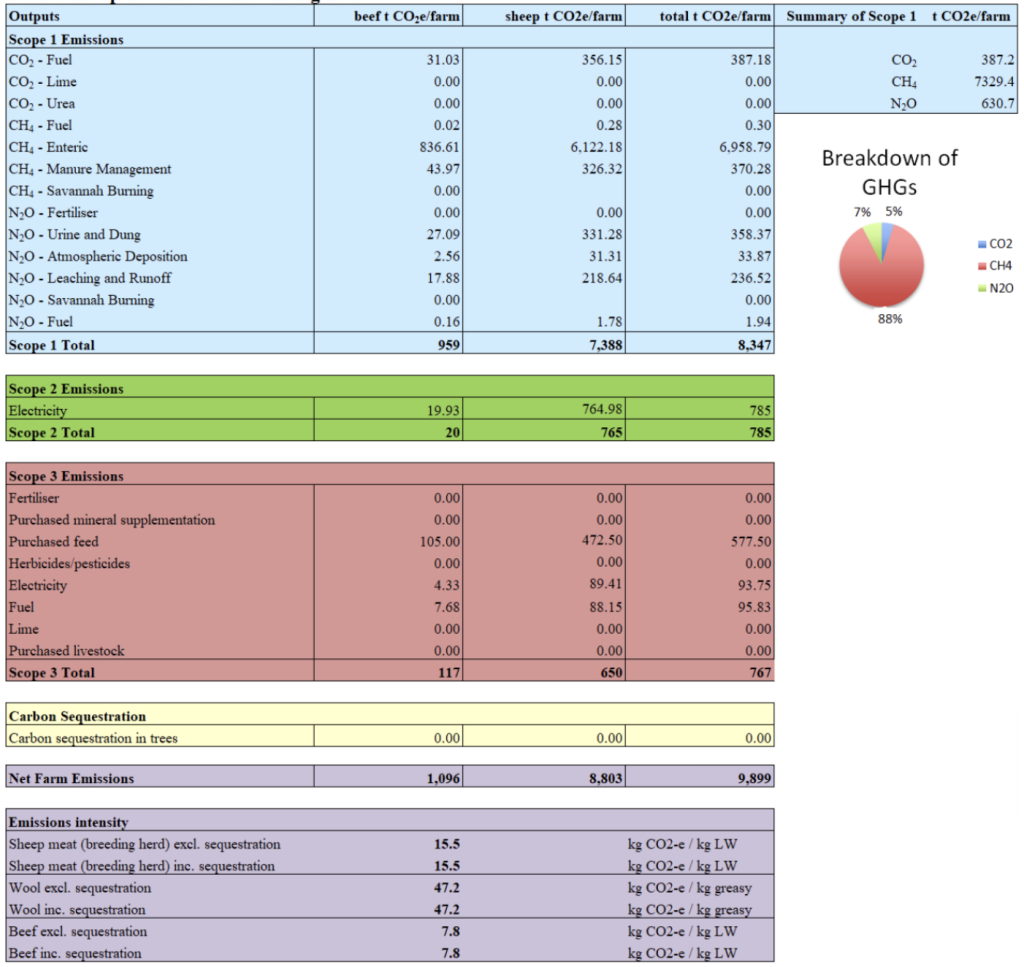
Table 6 – GHG emissions estimation for 30,000 DSE

Income, Costs and Gross Margin
The income, cost and gross margin at the two stocking rates is shown in Table 7.
Table 7 – Income, costs and gross margin at the two stocking rates.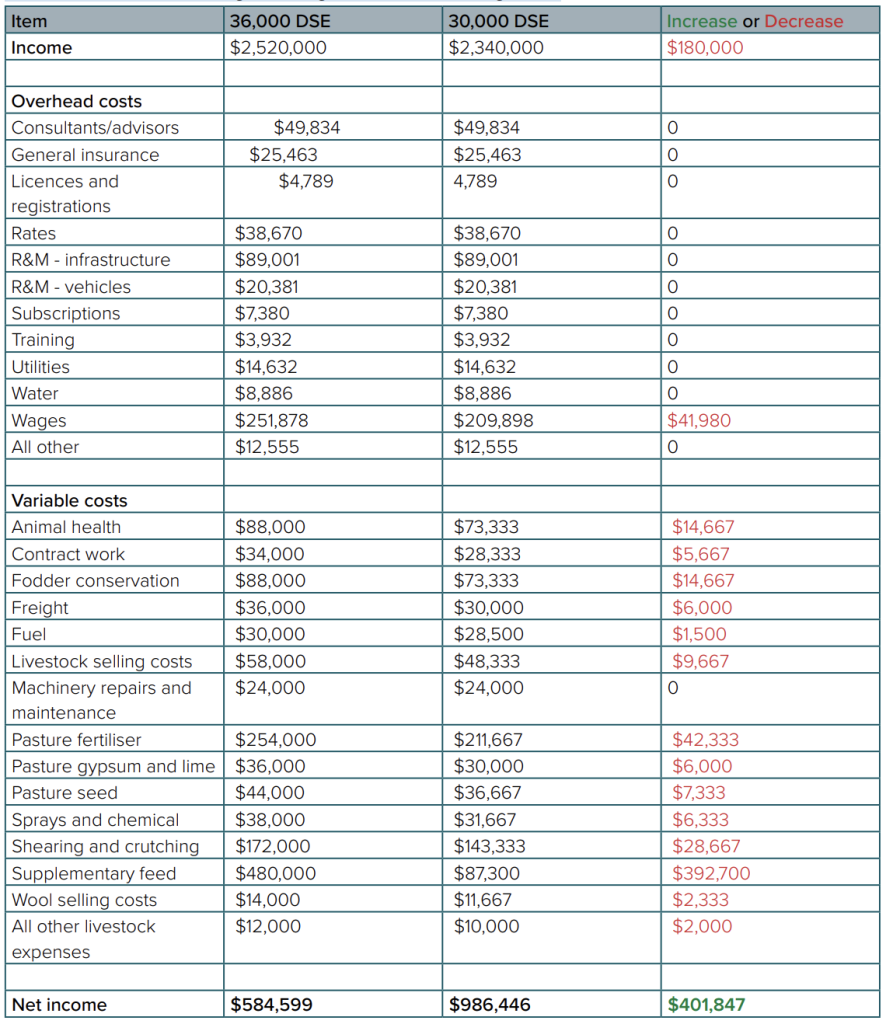
Discussion
Lowering the stocking rate of this farm from 36,000 DSE (18 DSE/ha) to 30,000 DSE (15 DSE/ha) reduced net farm emissions from 9,899t CO2-e to 7,876 t CO2-e (a reduction of 2,023 t CO2-e or 12.5%). At the same time, net income increased from $584,599 to $986,446 (an increase of $401,847 or 69%).
The major change from lowering the stocking rate was decreased supplementary feeding from 2,200 tonnes of grain and hay to 400 tonnes of grain and hay per annum. This reduced Scope 3 emissions from 767 t CO2-e to 263 t CO2-e per annum while reducing supplementary feeding costs from $480,000 per annum to $87,300 per annum (a saving of $392,700). Other major changes were lower wages (from $251,878 to $209,898, a saving of $41,980) and pasture fertiliser (from $254,000 to $211,667, a saving of $42,333).
Other savings are shown in Table 7.
The sheep meat emissions intensity of 15.5 kg CO2-e/kg LW was higher than the expected range (6-10; (Wiedemann, et al., 2016). The intensity from wool was also high (47.2 kg CO2-e/kg greasy) compared to a standard range (20-35 CO2-e/kg greasy) (Wiedemann, et al., 2016). This was because this sheep breed was bred primarily for meat production with a low yield of wool, so the emissions intensity would be quite high when compared to a breed bred primarily for wool production and might produce up to three times more wool (e.g. 6 kg vs 2 kg) per animal. Both numbers might have been lower if the enterprise was focused entirely on meat or wool.
The emissions intensity was slightly lower (41.3 CO2-e/kg greasy and 13.6 CO2-e/kg LW) at the lower stocking rate, which was also influenced by slightly higher live weight at sale of around 6 kg per animal.
Beef is a relatively minor part of the operation. The emissions intensity of 7.7 kg CO2-e/kg LW for the higher stocking rate and 7.2 kg CO2-e/kg LW for the lower stocking rate is slightly lower than a standard range of 9-18 CO2-e/kg LW (Wiedemann, et al., 2015).
Conclusion
Lowering the stocking rate on this South Australian farm led to greater profitability. There was a significant co-benefit in lowered greenhouse gas emissions.